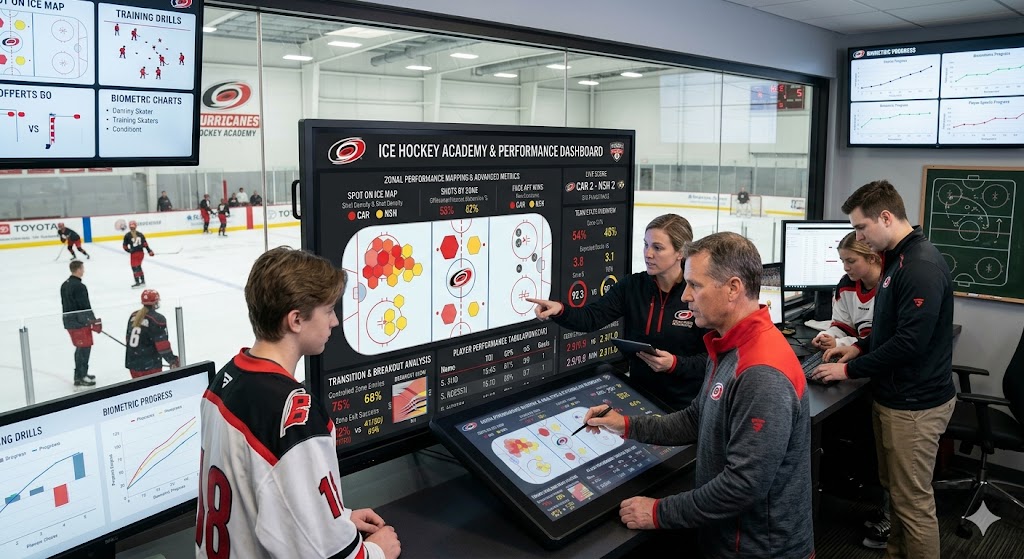
Advanced Ice Hockey Game Analytics & Performance Dashboard
We developed a data-driven sports analytics platform tailored for ice hockey, designed to convert complex game events into actionable coaching insights. By aggregating real-time match data like Carolina Hurricanes vs. Nashville the system provides granular team and player performance breakdowns, tactical evaluation, and high-fidelity visualizations for coaching staff.
What We Built
An end-to-end athletic intelligence pipeline, including:
Live Game Tracking: Real-time logging of goals, assists, penalties for both teams
Interactive Spatial Analytics: “Spots on Ice” and “Zones” maps showing shot density and face-off wins
Advanced Metric Engine: Calculations for Expected Goals (xG), Retrieval Share, and Zone Exit success
Tactical Breakout Modules: Detailed analysis of controlled entries/exits for transition efficiency
Player Performance Tabulation: Stats including Time on Ice (TOI), Corsi For percentage (CF%), and NetxG
The system acts as a high-resolution coaching dashboard, translating in-game data into actionable insights for both team and individual performance.
Key Features
Zonal Performance Mapping
Heatmaps and percentage breakdowns for defensive, neutral, and offensive zones
Goalie-specific tracking: Save Percentage (SV%) and Shots Against (SA)
Transition & Breakout Analysis
Controlled vs. Failed Entry comparisons to evaluate offensive zone penetration
Zone exit tracking linked to shot attempts or controlled entries
Predictive & Advanced Stats
Expected Goals (xG) visualizations to assess scoring quality
Shot outcome distributions (On Goal, Missed, Blocked) plotted on a digital rink
Multi-Period Comparative Logic
Side-by-side performance benchmarking for 1st, 2nd, and 3rd periods
How It Works
Game events ingested and timestamped for tracking goals, penalties & transitions
Shot & face-off coordinates mapped to rink templates to highlight high-traffic areas
Ring charts, bar graphs & rink overlays for instant coaching insights
Breakout Output & Retrieval Share to identify strengths & weaknesses
Results
Clear
retrieval share (e.g., 60% vs 40%) & puck loss tracking
Optimized
zone exit success (e.g., 75%) linked to shot creation
Automated
player stats across advanced performance metrics
Detailed
strength states & shot situations breakdown (Power Play vs Even Strength)
Value Dilevered
This project transforms raw game data into a strategic roadmap for victory. By quantifying “hidden” aspects of hockey like controlled exits and expected goals, the dashboard enables coaching staff to optimize line pairings, adjust strategies, and exploit opponent weaknesses with precision.